A Nominal Choropleth map is a map that attempts to show qualitative descriptive geographical data. This is a map of Africa that labels every city within the continent.
A Standardized Choropleth map is a map that represents data on average. This map is a map of Canada and its average population represented by percentage.
A bivariate map displays two variables on a single map by combining two different sets of graphic symbols or colors. A bivariate map is intended to convey the spatial distribution of two variables and the geographical concentration of their relationship. This map displays two different variables on the same map.
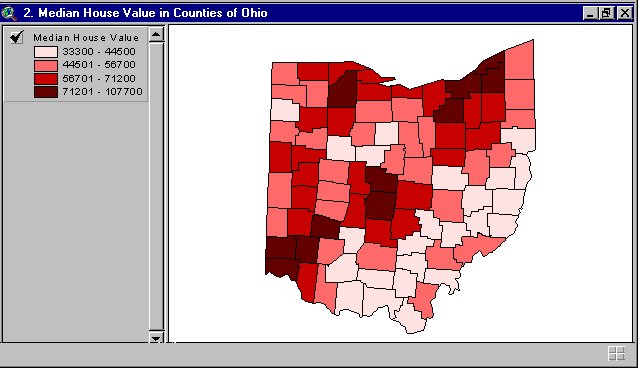
Classed Choropleth maps are better than unclassed, regardless of the symbol type used. Classed maps have a distinct and statistically significant advantage over unclassed choropleth maps. A classed choropleth map is a type of choropleth map that uses smaller intervals to portray the data. It is broken down into a scale and presented using colored intervals.
A Range Graded Proportional Circle map is a map that arranges circles in relation to the data. This map, as decribed by the figure above, represents a range graded proportional circle map because it attempts to represent what the population would look like in the "real-world". The larger the circle, the larger the urban population.
A Continuously Variable Proportional Circle map is a proportional circle map that uses circles to create data points. The variables being measured relate to the size of the circle used. This map is a continuous proportional circle map that represents the data and proportion of the data according to circle size.


